Monitoring Configuration
The monitoring subsystem is represented by a dedicated daemon (onemonitord) running as part of the OpenNebula Daemon (oned), that gathers information relevant to the Hosts and the Virtual Machines, e.g. Host status, basic performance indicators, Virtual Machine status, and capacity consumption. This information is collected by executing a set of probe programs provided by OpenNebula. The output of these probes is sent to OpenNebula using a push mechanism. It’s part of the operating system package opennebula.
Overview
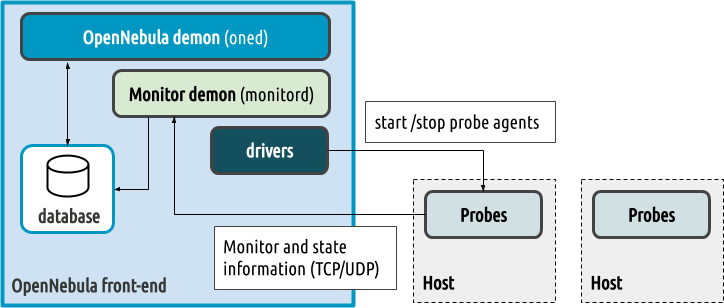
Each host periodically sends monitoring data via the network to the Front-end, which collects and processes it in a dedicated module. This distributed monitoring system resembles the architecture of dedicated monitoring systems, using a lightweight communication protocol and a push model.
As part of the regular start process, OpenNebula starts a onemonitord daemon running in the Front-end, that listens for network connections on port 4124 (both UDP and TCP). Initially, OpenNebula connects to the hosts using SSH and starts a light agent that executes the probe scripts to collect and send data back to the onemonitord daemon in the Front-end.
Probes are structured in information categories for host and virtual machine information. At regular intervals (in seconds) (configurable per category in the monitord.conf) the data is transmitted, so the monitoring subsystem doesn’t need to make any additional connections to gather it.
If information stops coming from a specific Host, OpenNebula detects it by missing heartbeats and pro-actively connects to the particular Host over SSH and restarts probes.
Important
The firewall on the Front-end (if enabled) must allow incoming TCP and UDP packets on port 4124 from the Hosts.
Configuration
The monitor daemon (onemonitord) is configured in /etc/one/monitord.conf. The following table describes the configuration attributes for it:
Parameter |
Attribute |
Description |
|---|---|---|
|
Timer in seconds, monitord evaluates Host timeouts |
|
|
Wait time (seconds) without receiving any beacon before restarting the probes |
|
|
Seconds before Host monitoring information expires, 0 to disable monitoring. |
|
Database (main configuration taken from |
||
|
|
DB connections. DB needs to be configured to support oned + monitord connections. |
Network Configuration |
||
|
|
Network address to bind the UDP/TCP listener to |
|
Agents will send updates to this monitor address. If “auto” is used, agents will detect the address from the ssh connection Front-end -> host ($SSH_CLIENT), “auto” is not usable for HA setup |
|
|
Listening port |
|
|
Number of threads used to receive messages from monitor probes |
|
|
Absolute path to public key. Empty for no encryption. |
|
|
Absolute path to private key. Empty for no encryption. |
|
Probes Configuration |
||
|
|
Time in seconds to send heartbeat for the host |
|
Time in seconds to send host static/configuration information |
|
|
Time in seconds to send host variable information |
|
|
Time in seconds to send VM status (ie. running, error, stopped…) |
|
|
Time in seconds to send VM resource usage metrics. |
|
|
Send a complete VM report if probes stopped more than |
|
Additionally, you need to enable the drivers that onemonitord will use to interface the hypervisor Nodes in your cloud. In general, the following attributes can be tuned in the arguments section of the driver configuration (IM_MAD):
Argument |
Description |
|---|---|
|
number of retries when monitoring a host |
|
number of threads it limits the hosts (started/stopped) at the same time |
|
Timeout in seconds to execute external commands (e.g. ssh connections) |
Configure Probes
To fine tune monitoring probes you can adjust parameters in /var/lib/one/remotes/etc/im/<hypervisor>-probe.d/probe_db.conf. The following parameters can be tuned:
Parameter |
Description |
|---|---|
|
[minutes] VM status entries older than this will be deleted |
|
Number of monitor cycles a VM is missing to consider it definitely lost |
Configure OpenNebula
No initial configuration is required because the monitoring daemon is enabled by default in /etc/one/oned.conf as a monitor driver.
For example:
IM_MAD = [
    NAME       = "monitord",
    EXECUTABLE = "onemonitord",
    ARGUMENTS  = "-c monitord.conf",
    THREADS    = 8 ]
This should be the only driver activated in this file. The following configuration attributes are available:
Parameter |
Description |
|---|---|
|
Number of threads used to process messages from monitor daemon |
Service Control and Logs
Monitoring daemon is started as part of OpenNebula Daemon (service opennebula). There is no dedicated system service.
Logs are located in /var/log/one in following file(s):
/var/log/one/monitor.log/var/log/one/oned.log(relevant monitoring messages may appear also in OpenNebula log)
Advanced Setup
The following sections present optional advanced setups, improving the security or performance of the monitoring subsystem:
Encryption of Monitoring Messages
You can configure the probes to encrypt the monitoring messages sent to the Front-end. This may help to secure your environment when some of the hypervisors are in cloud/edge locations. Follow the next steps to configure encryption.
Generate dedicated public and private keys for the monitor system and store them in a safe place (we’ll use
/etc/one). Do not use any passphrase to encrypt the private key.
ssh-keygen -f /etc/one/onemonitor
Generating public/private rsa key pair.
Enter passphrase (empty for no passphrase):
Enter same passphrase again:
Your identification has been saved in /etc/one/onemonitor
Your public key has been saved in /etc/one/onemonitor.pub
The key fingerprint is:
SHA256:XlFQK35lZ0i2ncAZUbmkKJ8F8ra5uQJA3VGa36OP10I V
Change the format of the public key to PKCS#1
ssh-keygen -f /etc/one/onemonitor.pub -e -m pem > /etc/one/onemonitor_pem.pub
Update configuration
/etc/one/monitord.confand set path to keys:
NETWORK = [
  ...
  PUBKEY = "/etc/one/onemonitor_pem.pub",
  PRIKEY = "/etc/one/onemonitor"
]
Restart OpenNebula
systemctl restart opennebula
Restart the probes on the hosts to use the configured keys:
# sudo -u oneadmin onehost sync -f
Monitoring in HA
If you are running OpenNebula in an HA cluster, it is recommended to use a virtual IP for the MONITOR_ADDRESS attribute. This way the RAFT hook will move the monitor address and the probes do not need to be restarted. Adjust the RAFT hook configuration to include the monitor IP, see more details in OpenNebula Front-end HA (Raft Hooks).
Adjust Monitoring Intervals
For medium-sized clouds, the default values should perform well. For larger environments, you may need to tune your OpenNebula installation with appropriate values of the monitoring parameters and monitoring intervals in the PROBES_PERIOD section. The final values should consider the number of hosts and VMs that, in turn, will determine the processing requirements for OpenNebula. Also, you may need to increase the number of threads (THREADS) in /etc/one/oned.conf and drivers in /etc/one/monitord.conf.
If the system is not working well, the problem could be in database performance. If the number of virtual machines and hosts is too large and the monitoring periods too low, OpenNebula will not be able to write that amount of data to the database.
Troubleshooting
Important
When debuging the monitor system, we recommend increasing the DEBUG level for both oned and onemonitord, and restarting OpenNebula.
Healthy Monitoring System
The default location for monitoring the log file is /var/log/one/monitor.log. Approximately every configured monitor period OpenNebula receives the monitoring data of every Virtual Machine and of a Host as follows:
Sun Mar 15 22:12:15 2020 [Z0][HMM][I]: Successfully monitored VM: 0
Sun Mar 15 22:13:10 2020 [Z0][HMM][I]: Successfully monitored host: 0
Sun Mar 15 22:13:45 2020 [Z0][HMM][I]: Successfully monitored VM: 2
Sun Mar 15 22:15:10 2020 [Z0][HMM][I]: Successfully monitored host: 1
However, if in /var/log/one/monitor.log a Host is being monitored actively periodically (every MONITORING_INTERVAL_HOST seconds) then the monitorization is not working correctly:
Sun Mar 15 22:31:55 2020 [Z0][HMM][D]: Monitoring host localhost(0)
Sun Mar 15 22:31:59 2020 [Z0][HMM][D]: Start monitor success, host: 0
Sun Mar 15 22:35:10 2020 [Z0][HMM][D]: Monitoring host localhost(0)
Sun Mar 15 22:35:19 2020 [Z0][HMM][D]: Start monitor success, host: 0
If this is the case, it’s probably because the Monitor Daemon isn’t receiving any data from probes and it could be caused by the wrong UDP settings. You should not see a restarting of the onemonitord process.
Monitoring Probes
To troubleshoot errors produced during the execution of the monitoring probes, try to execute them directly through the command line as oneadmin in the Hosts. Information about malformed messages should be reported in /var/log/one/oned.log or /var/log/one/monitord.log
Tuning and Extending
The monitor system can be easily customized to include additional monitoring metrics. These new metrics can be used to implement custom scheduling policies or gather data of interest for the Hosts or VMs. Metrics are gathered by probes, simple programs that print the metric value to standard output using OpenNebula Template syntax. For example, in a KVM hypervisor, the system usage probe outputs:
./linux_usage.rb
HYPERVISOR=kvm
USEDMEMORY=2147156
FREEMEMORY=5831016
FREECPU=792
USEDCPU=8
NETRX=0
NETTX=0
or, the NUMA configuration probe:
./numa_host.rb
HUGEPAGE = [ NODE_ID = "0", SIZE = "2048", PAGES = "0" ]
HUGEPAGE = [ NODE_ID = "0", SIZE = "1048576", PAGES = "0" ]
CORE = [ NODE_ID = "0", ID = "3", CPUS = "3,7" ]
CORE = [ NODE_ID = "0", ID = "1", CPUS = "1,5" ]
CORE = [ NODE_ID = "0", ID = "2", CPUS = "2,6" ]
CORE = [ NODE_ID = "0", ID = "0", CPUS = "0,4" ]
MEMORY_NODE = [ NODE_ID = "0", TOTAL = "7978172", DISTANCE = "0" ]
Probes are structured in different directories that determine the frequency in which they are executed, as well as the data sent back to the Front-end. The layout in the filesystem is:
<hypervisor_name>-probes.d
|-- host
|   |-- beacon
|   |   |-- date.sh
|   |   |-- ...
|   |
|   |-- monitor
|   |   |-- linux_usage.rb
|   |   |--...
|   |
|   `-- system
|       |-- architecture.sh
|       |-- ...
`-- vm
    |-- monitor
    |   |-- monitor_ds_vm.rb
    |   |-- ...
    |
    `-- status
        `-- state.rb
The purpose of each directory is described in the following table:
Directory |
Purpose |
Update Frequency |
|---|---|---|
|
Heartbeat & watchdog to collect rogue probe processes |
|
|
Monitor information (variable) (e.g. memory usage) stored in |
|
|
General quasi-static info. about Host (e.g. NUMA nodes) stored in |
|
|
Monitor information (variable) (e.g. used cpu, network usage) stored in |
|
|
State change notification, only send when a change is detected |
|
If you need to add custom metrics, the procedure is:
Develop a program that gathers the metric and output it to stdout
Place the program in the target directory. Depending on the nature and object it should be one of
host/monitor,host/systemorvm/monitor. You should not modify probes in the other directories.Increment the
VERSIONnumber in/var/lib/one/remotes/VERSIONDistribute changes to the hosts by running
onehost sync.
Usage
Getting Monitoring Information in CLI
The information that you can retrieve is:
CAPACITY/FREE_CPUCAPACITY/FREE_MEMORYCAPACITY/USED_CPUCAPACITY/USED_MEMORYSYSTEM/NETRXSYSTEM/NETTX
You can get monitoring information in three different ways:
Table
onehost monitoring 0 USED_MEMORY --unit G --n 10 --table
Host 0 USED_MEMORY in GB from 09/06/2020 09:36 to 09/06/2020 14:38
TIME VALUE
14:09 6.48 GB
14:12 6.54 GB
14:16 6.54 GB
14:19 6.54 GB
14:22 6.53 GB
14:25 6.42 GB
14:29 6.43 GB
14:32 6.44 GB
14:35 6.49 GB
14:38 6.48 GB
CSV
onehost monitoring 0 USED_MEMORY --unit G --n 10 --csv ';'

TIME;VALUE
14:09;6.48 GB
14:12;6.54 GB
14:16;6.54 GB
14:19;6.54 GB
14:22;6.53 GB
14:25;6.42 GB
14:29;6.43 GB
14:32;6.44 GB
14:35;6.49 GB
14:38;6.48 GB
Plot
onehost monitoring 0 USED_MEMORY --unit G --n 10

     Host 0 USED_MEMORY in GB from 09/06/2020 09:36 to 09/06/2020 14:38

 6.54 +----------------------------------------------------------------+
      |     *+     +     +      + A    +     +     +      +      +     |
 6.52 |-+  *                       *                                 +-|
      |   *                        *                                   |
      |  *                          *                                  |
  6.5 |-*                           *                                +-|
      |*                             *                        A******  |
 6.48 |-+                            *                       *       A-|
      |                               *                     *          |
      |                               *                    *           |
 6.46 |-+                              *                  *          +-|
      |                                *                 *             |
 6.44 |-+                               *            ***A            +-|
      |                                 *      **A***                  |
      |                                  * ****                        |
 6.42 |-+                                A*                          +-|
      |      +     +     +      +      +     +     +      +      +     |
  6.4 +----------------------------------------------------------------+
    14:09  14:12 14:15 14:18  14:21  14:24 14:27 14:30  14:33  14:36 14:39
                                    Time