Grafana Visualization
Requirements
This guide assumes you already have an up-and-running Grafana service. If you do not already have Grafana installed, please refer to the following guides:
Grafana Dashboards
- We provide three dashboard templates that can be customized to your needs:
- Dashboard to visualize Virtual Machine information
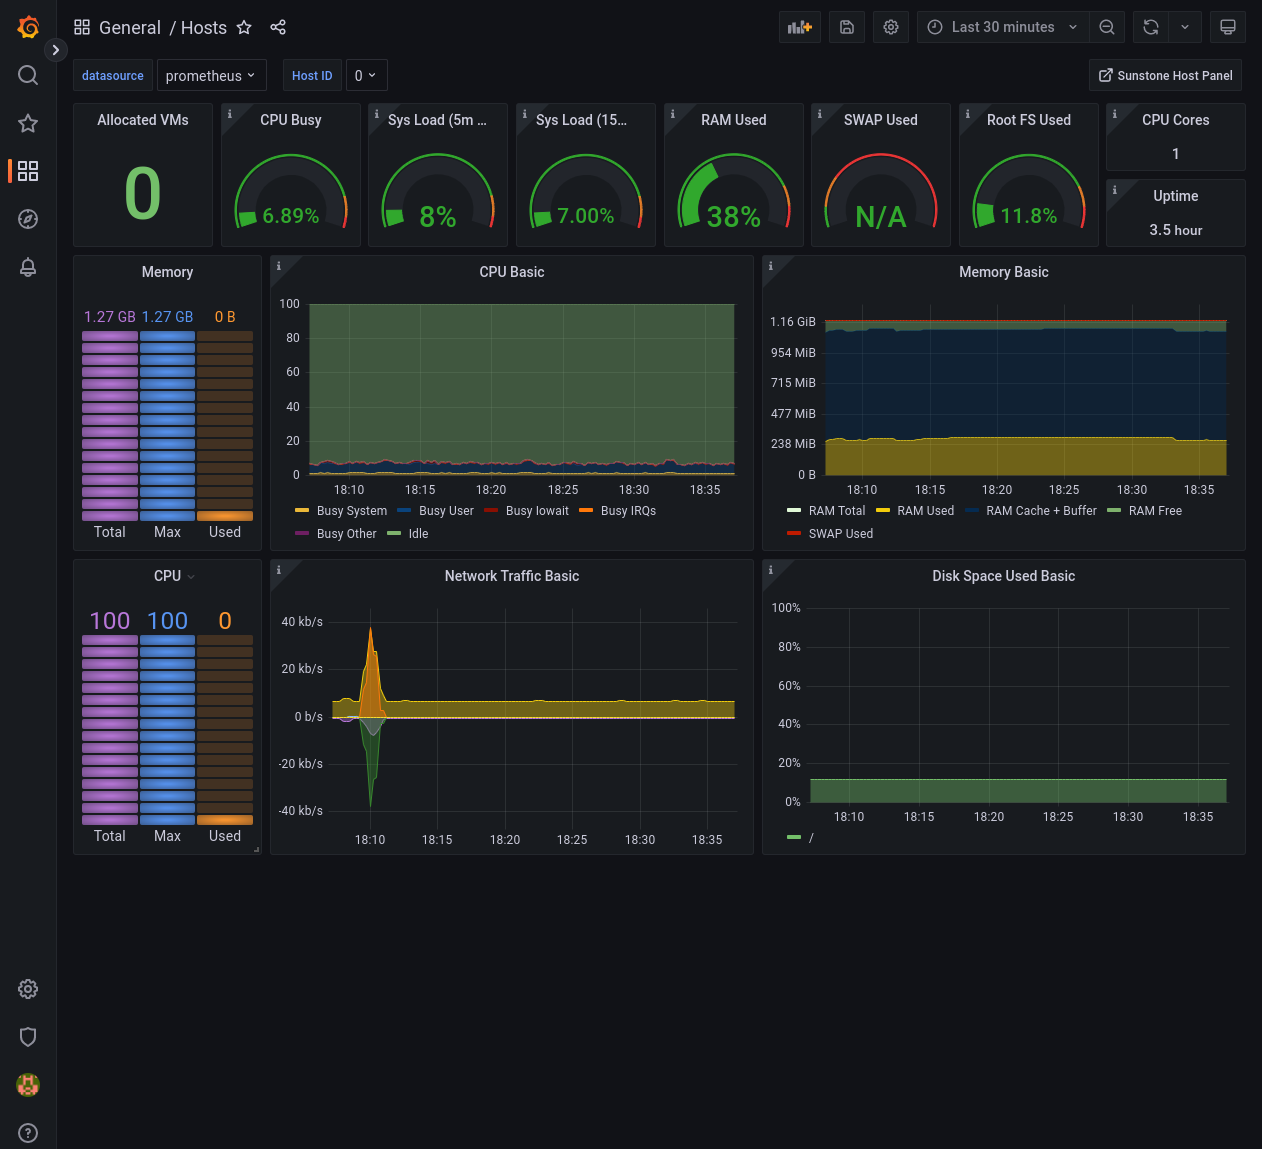
/usr/share/one/grafana/dashboards/vms.json. - Dashboard to visualize Host information
/usr/share/one/grafana/dashboards/hosts.json. - Dashboard to visualize the overall status of the OpenNebula cloud
/usr/share/one/grafana/dashboards/opennebula.json.
- Dashboard to visualize Virtual Machine information
You can easily import these dashboards by copying the contents of these files in the Dashboards > + Import form.
The Virtual Machine and Host dashboards are by default indexed by ID but this can easily be changed in the Settings > Variables dialog to use one_vm_name and one_host_name, respectively.
Grafana Provisioning
Grafana supports provisioning, which can be used to automatically reconfigure Grafana instances in shell scripts or automation engines such as Ansible.
In case of OpenNebula you can use it to, for instance, configure datasources and dashboards:
# mkdir -p /etc/grafana/provisioning/datasources/
# cat >/etc/grafana/provisioning/datasources/prometheus.yml <<'EOF'
apiVersion: 1
datasources:
- name: prometheus
  type: prometheus
  access: proxy
  url: http://localhost:9090
  isDefault: true
  editable: false
EOF
$ ssh -L 9090:localhost:9090 user@opennebula-server-running-prometheus
Otherwise, provide the FQDN or IP address and make sure that you can access the Prometheus instance from your web browser.
# mkdir -p /etc/grafana/provisioning/dashboards/
# cat >/etc/grafana/provisioning/dashboards/opennebula.yml <<'EOF'
apiVersion: 1
providers:
- name: opennebula
  type: file
  folder: ONE
  options: { path: /usr/share/one/grafana/dashboards/ }
EOF
# systemctl restart grafana-server.service
After the grafana-server.service restarts you should be able to connect and verify that the prometheus datasource
is operational and the OpenNebula dashboards show live data.
Please refer to the official documentation to learn more about Grafana provisioning.
GIVE FEEDBACK
Was this resource helpful?
Glad to hear it
Sorry to hear that